MAP 1
Clear, simple and straightforward. I have now learnt how to move the continents around and place them better within the map. So much for continental drift ...
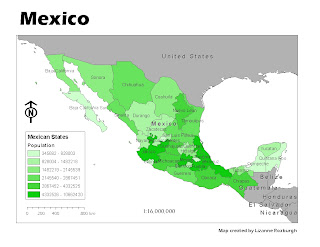
MAP 2
 This was a difficult map to do in terms of making it look good. The map is cluttered and I am not sure what the purpose of this map would be (other than to have us practice making a map). I stumbled upon the setting to add a halo around the text and I think it helps to make the annotations on the map clearer.
MAP 3

My first attempt to display a raster data set. I would not have thought so, but I like the contrast between the red and blue in terms of showing elevation. Blue is usually reserved for water features, but it was fun being able to use it to represent land for a change.
No comments:
Post a Comment